Temperature Mapping Study: Method, Sensors and Standards
Temperature mapping is the study that proves temperature and humidity are uniform and within specification everywhere inside a controlled space, not just at one convenient sensor. By placing calibrated data loggers throughout a room, chamber or storage unit and recording over time, temperature mapping reveals the hot and cold spots that a single fixed reading would completely miss.
This guide explains what a temperature mapping study involves, where it is used, the method and sensors, and the standards that apply.
Table of contents
- What is temperature mapping?
- Why temperature mapping matters
- Where it is used
- Sensors and method
- The mapping process
- Standards and compliance
- FAQs
What is temperature mapping?
Temperature mapping, sometimes called thermal mapping, is the placement of many calibrated sensors across a space to record temperature — and usually humidity — over a set period. The data shows how conditions vary from point to point and over time, so you can prove the whole volume stays within its limits. It complements continuous environmental monitoring, which watches a few fixed points once mapping has established where the risks are.
Why temperature mapping matters
- Finds hot and cold spots — uniformity is proven, not assumed.
- Protects stored product — medicines, samples and vaccines stay in specification.
- Places monitoring sensors correctly — mapping shows where fixed sensors should sit.
- Supports compliance — auditors expect documented mapping for controlled storage.
Where temperature mapping is used
- Cold rooms and refrigerators — pharmaceutical and vaccine storage.
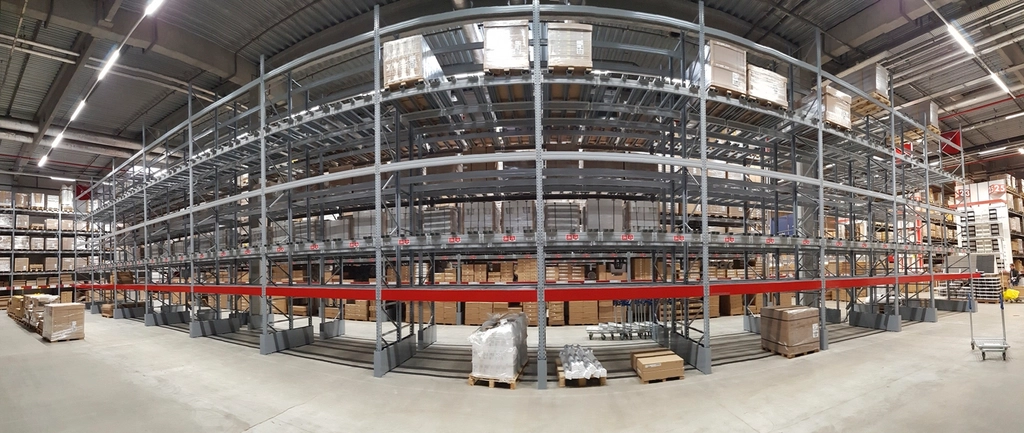
- Warehouses — ambient and controlled storage areas.
- Stability chambers and incubators — where conditions must be tightly held.
- Cleanrooms — where temperature and humidity form part of the room specification.
Only the limits that genuinely apply to a space are used — no invented tolerances.
Sensors and method
- Calibrated data loggers record temperature and humidity at each point over time.
- A planned sensor layout covers corners, centre, doors and near heat sources.
- A defined mapping period captures normal operation, and often door-opening or loading effects.
Because the record supports a compliance decision, every logger must be calibrated and traceable.
The temperature mapping process
- Define the study — agree the space, sensor positions, duration and acceptance limits.
- Verify sensors — confirm calibration and traceability of every logger.
- Place and record — position the loggers and record over the mapping period.
- Analyse the data — identify the warmest and coldest points and any excursions.
- Report — document uniformity, spots and a pass or fail against the limits.
Standards and compliance
- GDP and GMP — Good Distribution and Manufacturing Practice for storage and handling.
- ISO 14644 — cleanroom conditions where mapping supports a room specification (ISO 14644 overview).
- NABL / ISO/IEC 17025 — accreditation for the testing laboratory.
Temperature and humidity together
Most mapping studies record humidity alongside temperature, because both affect stored products and controlled processes. Confirming both across the whole space is part of proving conditions are genuinely uniform, and links directly to routine performance testing of the wider facility.
How often should temperature mapping be done?
Mapping is typically carried out when a space is new or modified, and then repeated periodically or after any change to layout, load or the cooling and heating system that could shift the conditions.
Common mistakes to avoid
- Too few sensors — hot and cold spots are missed.
- Ignoring doors and loads — real conditions include openings and stock.
- Too short a period — a mapping run must capture normal cycles.
- Uncalibrated loggers — results become indefensible.
Frequently asked questions
What is temperature mapping in simple terms?
It is placing many calibrated sensors across a space and recording over time to prove temperature and humidity stay within limits everywhere.
Why not just use one thermometer?
A single point hides hot and cold spots; mapping shows how conditions vary across the whole volume.
Where is temperature mapping needed?
Cold rooms, refrigerators, warehouses, stability chambers, incubators and cleanrooms with controlled conditions.
How long does a mapping study take?
The recording period is set to capture normal operation and cycles, commonly running over a defined number of hours or days.
Do you provide NABL-accredited temperature mapping?
Yes. Vanavil Calibrations carries out NABL-accredited temperature mapping on-site across Tamil Nadu.
Conclusion
Temperature mapping proves that a controlled space holds its conditions everywhere, not just at one sensor. By recording temperature and humidity across many points over time against recognised storage and cleanroom standards, it protects stored products and gives hospitals, pharmaceutical plants and warehouses documented proof of uniform, in-specification conditions.
Need a temperature mapping study? Contact our team today. Vanavil Calibrations provides NABL-accredited temperature mapping and clean room testing across Tamil Nadu with clear, audit-ready reports. Get in touch to plan your study.